
Using and Managing Data and Information
BA3020QA – Assignment 3
Task 1 (25 Marks)
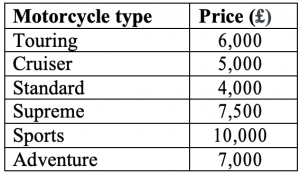
A motorcycle dealer specialises in selling six types of motorcycles named simply as ‘Touring’, ‘Cruiser’, ‘Standard’, ‘Supreme’, ‘Sports’ and ‘Adventure’. The shop wants you to create an Excel sales table consisting of the following entries:
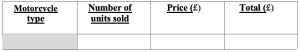
You need to use data-validation to retrieve any motorcycle (and its price) as a list for the cell presented in the shaded region above. The price (£) should be retrieved from the following table using an XLOOKUP formula. The number of motorcycles (N° of units) should not exceed TWO. The Total (£) column should be calculated using the following Excel formula:
= ° ×
Required:
Demonstrate the use of Excel data validation by producing some useful screenshots. Include formulae to show your understanding of how to use the data validation facility on Excel to retrieve information for specific cases from the table above. You should show how to retrieve the price and the total (in £) for the ‘Adventure’ motorcycle.
Note:
All your screenshots and explanation should be included on a maximum of TWO pages.
Task 2 (25 Marks)
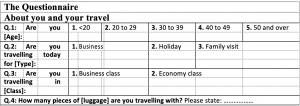
An airline company surveyed its passengers regarding their experience through the airport. They wanted to examine the level of passenger satisfaction and the time taken to get through the airport. The satisfaction level is measured using scores from 0=Not at all satisfied to 60=Very satisfied. The time through the airport was measured by providing each passenger a card once they had checked in at the airport, then returned to an agent once the passenger had reached the departure lounge, the time was measured in minutes. The following questionnaire was used and the data was recorded in a filename “Airport.xlsx”.
Required:
- Produce a well labelled frequency and percentage frequency tables for each of the following variables:
-
- Age
- Type (of travel)
- Draw a well labelled bar chart representing the variable “Age”.
- Use Excel formulae to calculate the descriptive statistics (Location and spread) for the variable “Satisfaction”. The descriptive statistics should include the minimum, maximum, both quartiles, mean, median, variance, standard deviation, range and inter-quartile range. Please note that the statistics should be presented correct to a whole number but the mean and standard deviation should be presented correct to the nearest 1 decimal place. You should also show the formulae used for statistics.
- Draw a well labelled box plot for the variable “Satisfaction” split by “Class” of travel.
- Draw a scatter diagram of the “satisfaction” score against “time” taken and show the linear regression equation in context (not in x and y). Use an Excel formula to calculate the correlation coefficient.
Note:
All variables should be clearly named and their correct categories clearly labelled. Graphs should be appropriate and correctly labelled and each of them on the same page. Any calculations should be clearly presented and explained.
Task 3 (25 Marks)
A small hotel in central London has 8 rooms. Based on data collected over the last five years, it was estimated that the probability a room is occupied on any particular “weekend” night (Saturday and Sunday) is 0.8. This is the probability of success. On any particular “weekend” night, a hotel is only occupied (Success) or not occupied (Failure). There are no other possibilities.
The occupancy rate on any particular night during a weekday (Monday to Friday) is assumed to be 50%, i.e. a room has a probability of 0.5 to be occupied during any weekday.
Required:
- What is the probability that at least half of the hotel is occupied on any weekend night? You need to show the table of values for your calculations.
- One Wednesday during a certain week, 2 out of the 8 rooms were occupied. What is the p-value? You need to show the table of values for your calculations.
Note:
Show all your calculations in well laid-out Excel spreadsheet tables with clear headings and include formulas. Give your answers correct to 3 decimal places.
Task 4 (25 Marks)
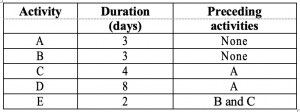
A plumber has decided to use the techniques of project management to plan a job. He knew all the different activities of the job, their precedence, and their average durations. They are shown in the following table:
Required:
- Draw a network diagram representing the sequence of activities and the dependence between them.
- Determine how long it will take to complete the job by conducting the forward pass
- By conducting the backward pass, identify the critical path and the non-critical path(s).
Note:
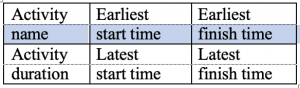
The work for this task should be produced using Word drawing facilities. The forward and backward passes should be clearly shown on the diagram. Each activity should be described using the notation shown in class as follows:
“You can order BA3020QA – Assignment 3 : Using and Managing Data and Information from our service and can get a completely high-quality custom paper. Our service offers any of the BA3020QA Academic paper written from scratch, according to all customers’ requirements, expectations and highest standards.”
100% Plagiarism Free
24X7 Customer Support
Multiple Revisions
100% Confidential
On-time Delivery
500+ Experts