
Module Code: MN4063QA
Module Subject: Understanding and Managing Data
PART 1
Task 1: Ungrouped Descriptive Statistics [10 marks]
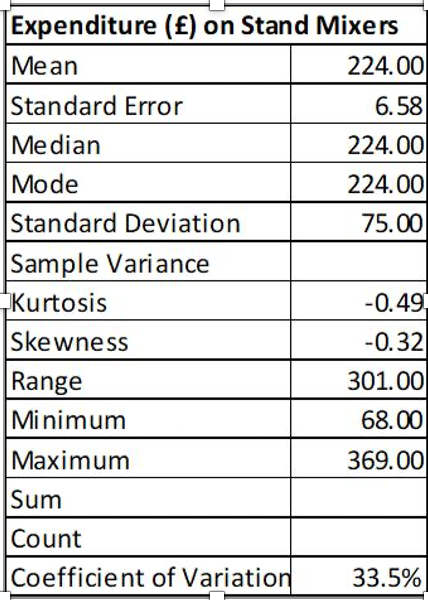
To gain some insights into the typical price consumers are willing to pay for a stand mixer, a retailer of kitchen appliances randomly selected 130 relevant invoices for transactions completed in October 2020. Descriptive statistics, computed to summarise the data, are presented in Table 1 below. NB: Some values are missing. This table has been made available in the Excel file named “MN4063QA July21CWK 1 Data” under the tab labelled
Task 1.
Table 1 – Ungrouped Descriptive Statistics
Required for Task 1 (Comments for task 1 should not exceed 50 words in total.)
- With reference to Table 1 above and using a calculator, find the Sum and Variance.Insert your values on the table and copy into your Word document.
- Interpret the mean and standard deviation in the context of the scenario provided.NB: You should not describe calculation methods.
Task 2: Grouped Descriptive Statistics [14 marks]
It was suggested to the retailer that the 130 transaction values could also be summarised in a grouped table (see Table 2 below). Three table templates based on Table 2 have been made available in the Excel file named “MN4063QA July21 CWK 1 Data” under the tab labelled Task 2.
Table 2 – Grouped Descriptive Statistics
| Expenditure (£) | Frequency |
| Under 100 | 14 |
| 100 and under 200 | 35 |
| 200 and under 300 | 65 |
| 300 and over | 16 |
| Total: | 130 |
Required for Task 2 (Comments for task 2 should not exceed 50 words in total.)
a) Using the three table templates provided in the Excel data file as a starting point, construct three tables in Excel.
-
- The first table should show the frequencies and percentage frequencies.
- The second table should show the ‘less than’ cumulative frequencies and cumulative percentage frequencies.
- Complete the third table to estimate the mean and standard deviation. You need to copy the Excel output (3 tables) into your Word document.
b) Compare the grouped data mean and standard deviation values to the ungrouped data mean and standard deviation under task 1.
-
- Why are the values different and which findings are more accurate; the ungrouped or grouped statistics? Justify your answer.
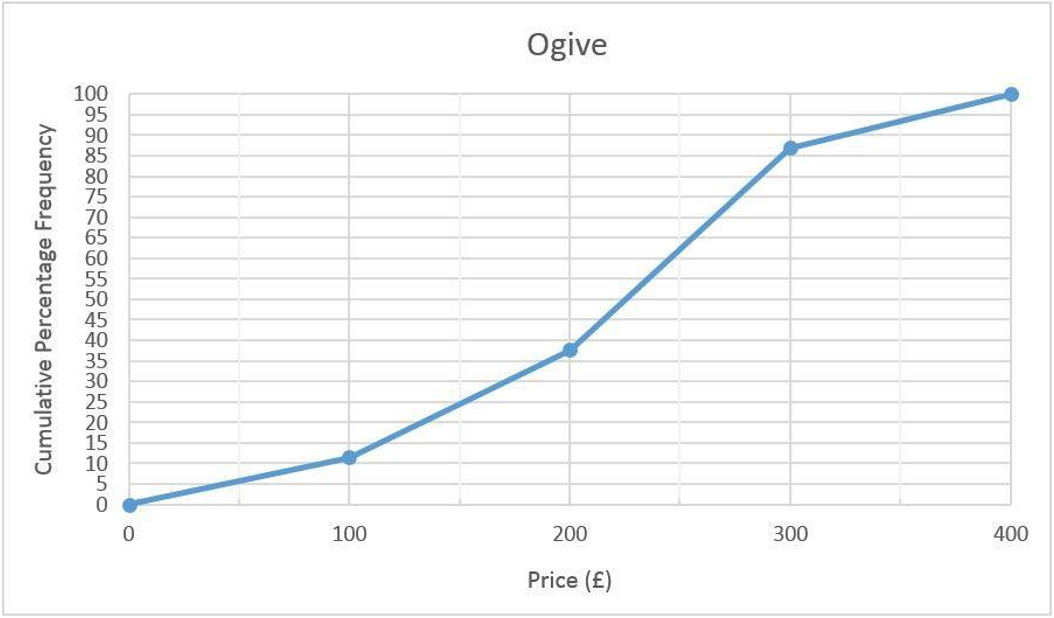
c) With reference to fig. 1 below (ogive), comment on the estimated minimum amount a consumer needs to spend on a stand mixer to belong to the top 25% in terms of expenditure.
Fig. 1 – Ogive Showing Cumulative Percentage Frequencies
Task 3: Data Types [8 marks]
The kitchen appliances retailer seeks to survey its customers to gain insights into key consumer characteristics, including demographic profiles and lifestyle preferences. It is believed this will help the company better understand its target consumers and strengthen its position in the market. However, before outsourcing the data collection fieldwork, the retailer seeks clarification on data types, as outlined in the requirements below.
Required for Task 3 (Comments for task 3 should not exceed 100 words in total.)
- With reference to examples relevant to the retailer’s information needs, discuss the differences between cross-sectional data and time series data and clearly state whether cross-sectional data, time series data or both types of data should be collected to gain insights into the demographic profile and lifestyle characteristics of its customers.
Use and credit one source. The citation and reference must be credited using the Harvardmethod. The reference is excluded from the 100-word limit.
Task 4: Networking [12 marks]
The retailer has seen a shift in the way in which consumers purchase items, such as kitchen appliances. Online retailing now accounts for over 80% of their sales and, to reflect this change, the retailer has decided to convert some of its retail space into warehouse space. This conversion project consists of 10 activities. For example, Activity C takes 3 weeks to complete and can only be started after Activity A has been completed. Information on the 10 activities is outlined in Table 3 below.
| Table 3 – Precedence Table | ||
| Activity | Preceding Activity | Duration (Weeks) |
| A | ……… | 6 |
| B | ……… | 4 |
| C | A | 4 |
| D | B | 2 |
| E | C | 6 |
| F | C,D | 5 |
| G | D | 3 |
| H | …….. | 8 |
| I | E,F,G | 5 |
| J | H,I | 2 |
Required for Task 4 (Comments for task 4 should not exceed 50 words in total.)
- With reference to Table 3, construct a network diagram by going through the forward and backward passes. You may draw your network diagram in Excel or Word. The network diagram needs to be copied into your Word file.
- Identify the critical path and duration of the project.
- Comment on the distinction between critical and non-critical activities.
Task 5: Relationships [12 marks]
To operate more effectively, the retailer wants to better understand the relationship between sales revenue, total costs, average order value and gross profit. To this end, data for the period 2014, quarter 1 to 2020, quarter 3 were made available. To complete task 5, refer to the data provided under the tab named “Task 5” in the “MN4063QA July21 CWK 1 Data” Excel file.
Required for Task 5 (Comments for task 5 should not exceed 150 words in total.)
- Construct a correlation matrix in Excel to show the correlation coefficients between quarterly Sales Revenue (£’000) and total costs (£’000), average order value (£) and gross profit (£’000). The correlation matrix needs to be copied into your Word file.
- With reference to the correlation matrix, identify the ‘best’ predictor of quarterly Sales Revenue (£’000) and briefly explain the reason for your choice.
- Create a scatter graph, plotting quarterly Sales Revenue (£’000) against the independent variable selected under point 2 above. The trend, regression equation and coefficient of determination should be shown on the graph. Copy the correctly labelled graph, with the correct units of measurement, into your Word file.
- Interpret the relevant correlation coefficient and the coefficient of determination in context.
- State the regression equation in context and interpret the values of the intercept and gradient in the context of the scenario.
Task 6: Expected Values [8 marks]
The retailer has the option to invest in either venture A or venture B. Both ventures require aninvestment of £39,000.
The net expected values and standard deviations for the two ventures are stated in Table 4 below.Table 4 –
Outcomes
| Venture A | Net EV = £47.0 | Standard Deviation = £30.08 |
| Venture B | Net EV = £41.2 | Standard Deviation = £13.32 |
Required for Task 6 (Comments for task 6 should not exceed 50 words in total.)
- Calculate the coefficients of variation for venture A and venture B.
- Assuming the retailer is risk averse, which project should be chosen?
Task 7 [6 marks]
This task requires reflection to provide insights into the process and quality of personal learning. Your reflection should focus on your actions, motivations and emotions and should analyse what changes will be made to practice in light of experiences, feedback and reflection. A good reflection will help you understand what, why and how you learn.
NB: You should not comment on the theories of reflection. You should also not evaluate teaching orthe module for this exercise.
Required for Task 7 (Comments for task 7 should not exceed 150 words in total.)
- What do you think you did particularly well in this assignment?
- What was the most challenging aspect of this coursework and why was this the case?
- What would you do differently next time?
“You can order BMGT2010 Essential PR Assignment from our service and can get a completely high-quality custom paper. Our service offers any of the BMGT2010 Academic paper written from scratch, according to all customers’ requirements, expectations and highest standards.”
100% Plagiarism Free
24X7 Customer Support
Multiple Revisions
100% Confidential
On-time Delivery
500+ Experts