
Module Code: PBHL20003
Module Subject: Social Epidemiology and Statistics
Task description
Determines how well you understand fundamental epidemiological and statistical concepts and their application in public health.
Question 1 [3 marks]
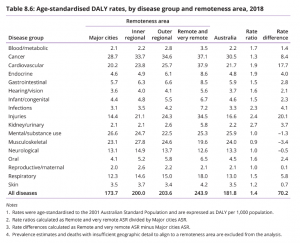
The two figures below are taken from the Australian Burden of Disease Study (2018 data)*. The first figure show DALY# rate by life stage and remoteness. The second shows DALYs by disease groups and remoteness areas.
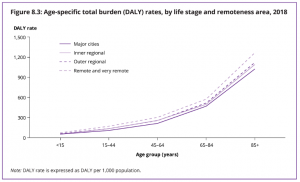
*Australian Institute of Health and Welfare 2021. Australian Burden of Disease Study: impact and causes of illness and death in Australia 2018. Australian Burden of Disease Study series no. 23. Cat. no. BOD 29. Canberra: AIHW. This report provides estimates of the burden of disease analysis for the Australian population in 2018, using the disability-adjusted life years (DALY) measure.
# Definition of DALY: One disability adjusted life year (or 1 DALY) represents 1 year of healthy life lost, either through premature death (‘years of life lost’ or YLL) or from living with an illness or injury (‘years lived with disability’ or YLD).
a) What conclusions do you draw from Figure 8.3?
b) What conclusions do you draw from Figure 8.6?
c) (From a public health perspective), what factors may be impacting on the burden of disease as shown in the above two figures?
Question 2 [4 marks]
A study was conducted of the association of high birthweight (macrosomia) with social determinants of health (SDH) using a specially created Index. Macrosomia is defined as a birthweight of 4500 grams or more at birth. A composite Antenatal Health Index algorithm was calculated, comprising SEIFA*, access to transport facilities, access to antenatal care and extreme weather events impact to create the SDH Index. The SDH Index was classified as 1-3, with 1=low SEIFA, poorer transport access, poorer access to antenatal care, and significant impact from extreme weather events; and 3 = high SEIFA, excellent transport access, good access to antenatal care, and less impact from extreme weather events. The results are in the Excel workbook.
a) Compute the mean (Formulas > Insert Function > AVERAGE) and median (MEDIAN function) for each Antenatal Health Index category.
b) Examine the boxplots for the three Index categories. Compare the data. Discuss with reference to outliers, IQR and measures of central tendency
c) What are these data telling us?
d) Are there any considerations or potential limitations that you can identify in making inferences about these data findings? Why?
Question 3 [2 marks]
In a case-control study of osteoporosis, female outpatients over 60 years of age on long-term steroid use attending a high-risk falls clinic were compared to outpatients not on long-term steroid use. Osteoporosis was no more common in women on long-term steroid use than amongst the controls.
Conclusion: Long-term steroid use is not associated with an increased risk of osteoporosis in women.
Do you agree with the study findings? Why? a) What issues can you identify in the way women were recruited to this study?
b) Suggest an alternate method of recruitment to address these issues.
Question 4 [5 marks]
A group of researchers examined whether there was an increased risk of agricultural workers experiencing CVA (cardiovascular accident, or stroke) associated with adherence to the Australian standard Workplace health and safety (WHS) principles. The results are reported in the Excel workbook.
a) Calculate the relative risk for CVA according to whether the agricultural workers’ workplace adhered to Aust standard Workplace health and safety (WHS) principles [Excel]. Interpret the findings below in 1-2 sentences.
b) What is the (absolute) difference in CVAs in this population according to whether the workplace adhered to Aust standard Workplace health and safety (WHS) principles or not? [Excel] Interpret your answer below in 1-2 sentences.
c) Now calculate the proportion of CVAs in this population that would not have occurred where the workplace adhered to Aust standard Workplace health and safety (WHS) principles (attributable fraction) [Excel]. Give an interpretation of your answer below (1-2 sentences).
d) What is the overall prevalence of CVA in this study population? [Excel; answer below in words]
Question 5 [2 marks]
How can the concepts of relative risk and attributable risk help shape health policy and public health programs? Illustrate with an example.
Question 6 [4 marks]
Results of a screening test to detect the likelihood of lung cancer in the detectable pre-clinical phase (DPCP) through Low-dose CT screening for workers using high temperature insulating wools have recently been published. You are Director of Public Health advising the government whether or not you recommend an implementation of this test at the state level. The results of the published data are in Excel.
a) Calculate the sensitivity and specificity of the screening test in Excel, and write your answers below:
b) Calculate the false positive and false negative rates in Excel, and write your answers below:
c) Would you recommend the government adopt the implementation of this screening test? Why? Discuss your reasons in 2-3 sentences, with reference to your results:
d) What is the prevalence of lung cancer in the screened population? [calculate in Excel and write below]
Question 7 [5 marks]
Download the following research paper from the Moodle assessment page: BRYSON, H., MENSAH, F., PRICE, A., GOLD, L., MUDIYANSELAGE, S. B., KENNY, B., DAKIN, P., BRUCE, T., NOBLE, K., KEMP, L. & GOLDFELD, S. 2021. Clinical, financial and social impacts of COVID-19 and their associations with mental health for mothers and children experiencing adversity in Australia. PLOS ONE, 16, e0257357.
Read the paper carefully and then answer all questions below:
a) What type of study design is it?
b) What is the PICO that informs the research question?
c) What are the methods?
d) What are the main findings? (Summarise in 2-3 sentences)
e) What are the conclusion and implications? (3-4 sentences)
“You can order PBHL20003 Social Epidemiology and Statistics Assessment 3 from our service and can get a completely high-quality custom paper. Our service offers any of the PBHL20003 Academic paper written from scratch, according to all customers’ requirements, expectations and highest standards.”
100% Plagiarism Free
24X7 Customer Support
Multiple Revisions
100% Confidential
On-time Delivery
500+ Experts